@Afxgroup
Prepare for some wall of text :)
binutilsNewer binutils generate dwarf4/5 sections, which our-old-current one can't. But, the newer GCC we use now, of course, will create dwarf4/5 sections for any debugging purposes. Because of this, you can't load any binary created with newer GCC to the old GDB, which only know about old dwarfs. And the same about other debugging tools which has those old/new dwarf differences. If i remember right you can provide the version of dwarf being added into the resulting binary, but with my tests even if i say directly to use older dwarf, some link libs or whatever of new GCC still add pieces of drarf4/5.
I was trying to update binutils, and was able step by step update version by version, but then, month or two ago MigthyMax starting working on the latest binutils, and i was in hope it will be "soon for testing", but since then nothing, so maybe we need to back to our old route, and update binutils version by version (as it will less and less major changes if step by one version), to the version which can generate dwarf4/5 stuff.
To give a little more general info, the DWARF-5 support was added in 2017-02, so the version of Binutils coming after was 2.28. So we just need at least update on few versions up (to 2.29), without needs to port the very latest one which will be harder as it have more changes.
gprofRelated to the gprof: I was digging in pretty well, and find out why it didn't work for us currently:
short story: Gprof didn't generate proper output now because base address in elfs changes from 0x00000000 to 0x100000000, but respective parts in gprof weren't updated.
long story: gprof still working in SDK 53.2 (from the year 2008) even on today's amigaos. Things got broken in SDK 53.3 when gprof stops working (the same year 2008, just 9 days later). I start to compare everything between 2 versions of SDK, every single component, and find out that the default ldfscript was changed, and instead of :
PROVIDE (__executable_start = 0x00000000); . = 0x00000000 + SIZEOF_HEADERS;
It starts to have :
PROVIDE (__executable_start = 0x01000000); . = 0x01000000 + SIZEOF_HEADERS;
So, when we have there 0x01000000 in two places, then gmon.out created with wrong data inside, and profiling info can't be taken by clibs'2 profiler code. Once I manually change those 0x01000000 on 0x00000000, then gprof start working, and gmon.out output is correct one. Even on todays amigaos4 with today's 11.x GCC.
Of course, it may still have other issues, but at least the main one, is the change of the base adresses.
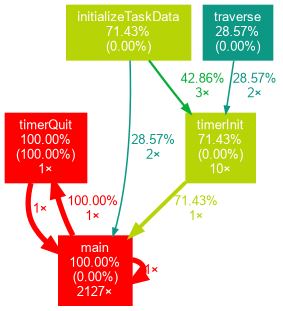
I even created for myself a patched ld.exe binary, where i just change 1 to 0 in necessary place, so base address start to be again from zeroes, and it makes gprof works. I even can profile a bit of things like for example Capehill's "Tequila" CPU profiler, and more or less big app "Horny" (binary size 1.5MB). And I even was able to use some python script which was built from gprof profiler to output colorful dot graphs. Just check this out:
(hit to open images in new tab for full size)
Tequila:

Horny app:

Then, I asked Thomas WTF, why there 10000000 as base address since some version, and he says that change to 0x01000000 was necessary for sobjs, since these did add a .plt section, potentially in front of the .text (which means 0 as text base address was no longer working).
Need to add, profiling works only with clib2 builds, the newlib one seems broken (or maybe even didn't implemented). Even if i change base address to 0x000000, the newlib one didn't works.
What we can do with all this information i honestly do not know, but, probably we need to fix in adtools gprof related code, to work with 0x1000000 , which probably only require changes in loadseg() stuff or whatever. As you know, files separated well in clib2, and relevant ones here:
https://github.com/afxgroup/clib2/tree/master/library/profileBut probably firstly, we need to port the version of BinUtils which can handle dwarf4/5, and then, step by step start fixing all other issues including support of GPROF again (as it really cool, with all those 3d party scripts and tools from Unix world).
Thomas back then when i asked him about all this, had a quick look at the gprof implementation, and seen that it implements a symbol table for the binary in question. And since we need to translate from the actual LoadSeg() address to .text segment addresses, the symbol table should take care of the translation.
Also, the code relate to gprof have some "/* FIXME: was p->lowpc; needs to be 0 and assumes" notes , but those wasn't added by Thomas.
Additionally, Matthias starting working on all this some time ago, and he added profiling support to kernel for x5000,x1000,sam and stuff , and a little patch this clib2's profiler code (patch should be in your repo too, as it was in Sodero's one for sure), but, he didn't finish sadly the whole fixes for this 0x100000 vs 0x000000 base address thing. Probably we can ask him how far he was, and what he did already, maybe his help will help to finish this.
PS. I wrote mail to Mathias, possibly help will be able to share his findings there. As i remember, he was close with all those 0x100000 vs 0x0000000 things, so possibly he can share some code showing how far he got.

 Donate


